Articles · Research
Data Analytics for Portfolio Management: The Metrics That Actually Predict Outcomes
A practical framework for monitoring a venture portfolio with data: the four metrics that matter most (Rule of 40, net revenue retention, burn multiple, and runway), how to read them as trends, and how to turn them into earlier decisions.

A portfolio is only as well-managed as the data you have on it. Most firms collect plenty of numbers — the problem is that they arrive in different formats, on no fixed cadence, and get re-read as prose every quarter instead of tracked as trends. This is a practical framework for fixing that: the handful of metrics that actually predict outcomes, how to read them over time, and how to turn a slipping line into an intervention while it still matters.
Collect a few metrics, reported the same way every period
Before any single metric, the discipline that makes analytics work is consistency. A small, fixed set of KPIs reported reliably every period is worth far more than an exhaustive dashboard nobody keeps current — because a trend is only readable when the definition behind it doesn't move. Decide what each company reports, define each metric precisely (is "revenue" recognized, billed, or ARR?), set the cadence, and hold to it. Comparability across companies and across quarters is the entire point.
The four numbers that tell you the most
For software-driven companies, four metrics carry most of the signal. None is sufficient alone; together they describe whether growth is real, durable, efficient, and survivable.
1. Growth efficiency — the Rule of 40
The Rule of 40 states that a company's revenue growth rate plus its profit margin should sum to 40% or more — a single check on whether growth is being bought at a reasonable cost. A company growing 60% while burning (−25% margin) clears it at 35... barely; one growing 20% at a 25% margin clears it comfortably at 45.
Bessemer, which popularized the rule, has since argued that treating growth and profit as interchangeable is flawed for later-stage companies, and introduced the Rule of X — which weights growth roughly 2–3× more heavily than free-cash-flow margin when it actually predicts valuation. The practical takeaway for a portfolio review: use the Rule of 40 as a fast screen, but weight growth more for earlier companies and margin more as they mature.
2. Net revenue retention — is the base durable?
Net revenue retention (NRR) measures revenue from existing customers over time, including expansion and churn but excluding new logos. It answers the question new-logo growth hides: if you stopped selling tomorrow, would the book grow or shrink? A common framing puts ~100% at "good," ~110% at "better," and ~120%+ at "best" for enterprise software, with the median venture-backed SaaS company around 106%.
The number to watch isn't NRR alone but the gap between net and gross retention. A healthy-looking 100% NRR can mask 20% churn offset by 20% expansion from a few accounts — when that gap runs wide, you're looking at concentration risk, not retention strength, and it can unwind fast.
3. Burn multiple — what does growth cost?
The burn multiple, popularized by David Sacks at Craft Ventures, is net burn divided by net new ARR — the dollars consumed to add each dollar of recurring revenue. Lower is better: a company adding $1M of ARR on $1M of burn is showing the market pull its product out; one spending $3M for the same $1M is pushing product into the market. Sacks calls it a catch-all, because almost any serious problem eventually shows up here — burn rises, net new ARR falls, or both. Roughly, ~1× is excellent and anything north of ~2× warrants a closer look.
4. Runway — how much time does the thesis have?
Growth, durability, and efficiency don't matter if the company runs out of room to prove them. Track months of runway at the current net burn, and flag companies dropping below ~12 months early — that is the window where a bridge, an introduction, or a strategic conversation is still cheap and optional rather than forced.
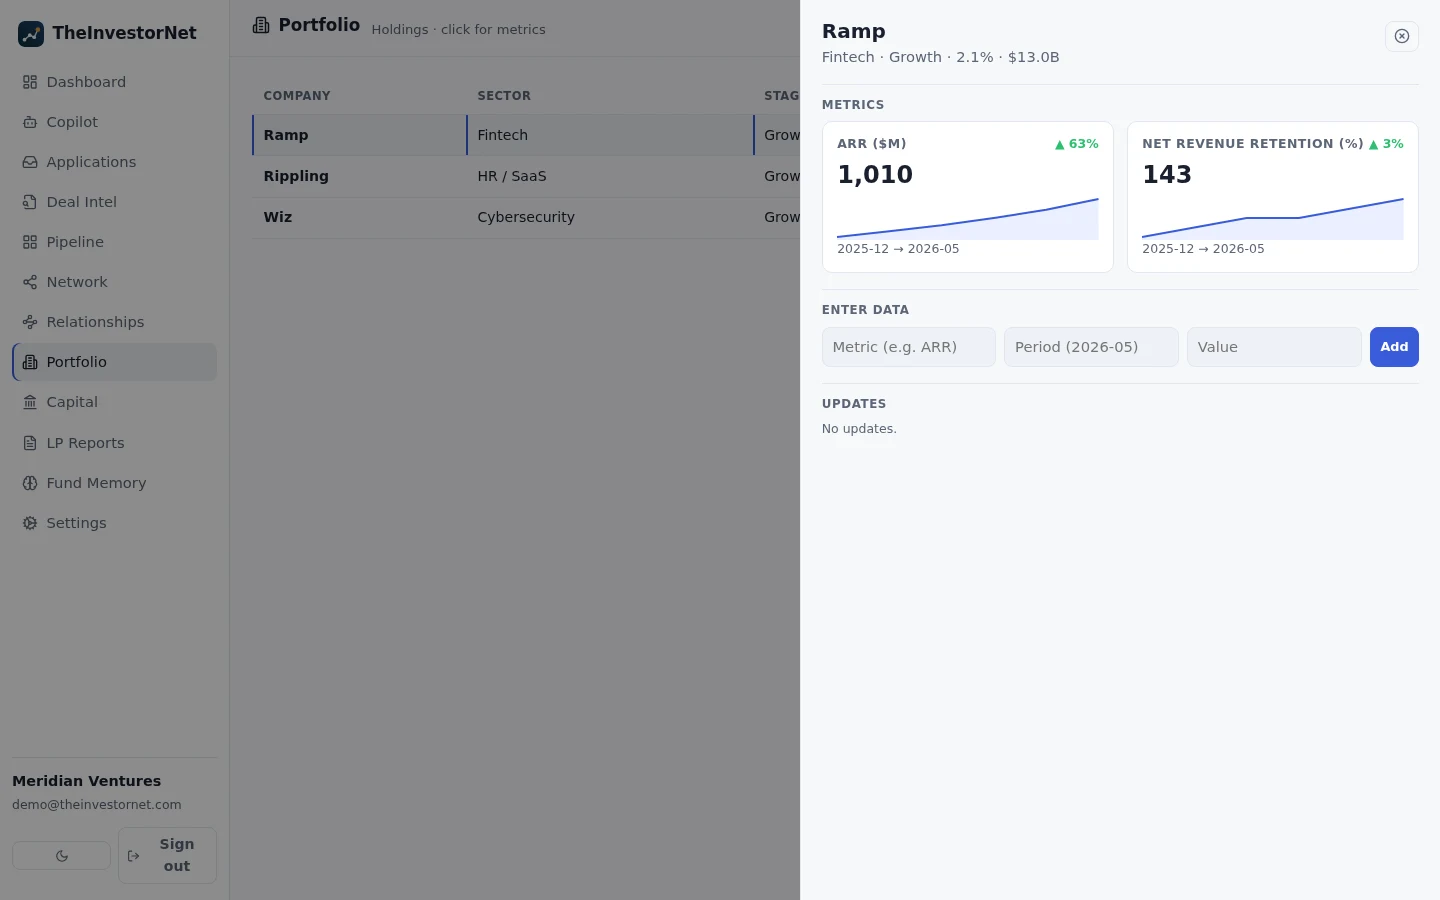
Turn point-in-time metrics into trends
A metric reported once is a data point; the same metric reported every period is a signal. The shift that changes portfolio management is moving from prose updates re-read each quarter to comparable series you can chart. When NRR, burn multiple, and the Rule of 40 are stored as time series per company, a slipping business shows up as a bending line two quarters before it becomes a board-meeting surprise — and you can compare it against the rest of the book on the same axes.
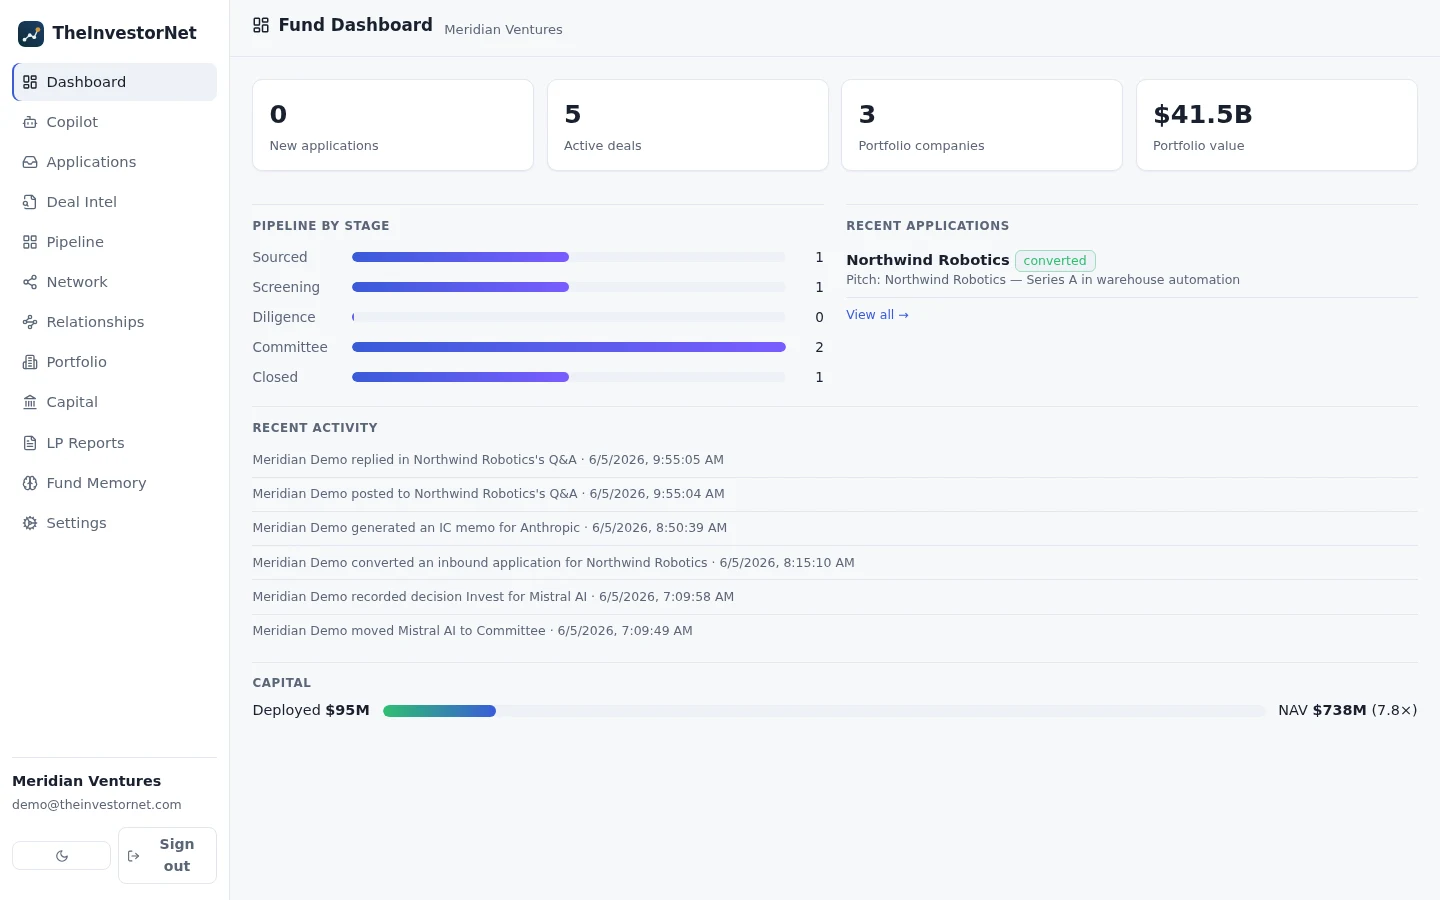
From dashboards to decisions
The point of the data isn't the dashboard — it's the earlier decision. Structured, comparable metrics let a firm spend less effort assembling the picture and more acting on it: reserves allocated to the companies the numbers say are working, support directed at the ones bending early, and partner attention spent on judgment rather than on reconciling spreadsheets. The same series also make reporting nearly free, because the LP narrative is drawn from the records you already keep current. (For the public-company analogue — reading filings to build comparable sets — see our companion piece on pre-IPO research and EDGAR filings.)
Further reading
- Bessemer Venture Partners — The Rule of X
- Rule of 40 — definition and history
- David Sacks / Craft Ventures — The Burn Multiple
- Gainsight — Net Revenue Retention: how to calculate it, with benchmarks